... some other goodies (well, that may not be the right word) to follow.
As was implied in my diary from earlier this week, the June 2012 Arctic sea ice report from the National Snow and Ice Data Center (NSIDC) showed a number of rather disturbing trends, which I'll show you below. Also, I'll write a little bit about the current heat wave and how it compares with historic heat waves of the past, with the help of an analysis technique that is pretty amazing to those of us in the meteorology/climatology business.
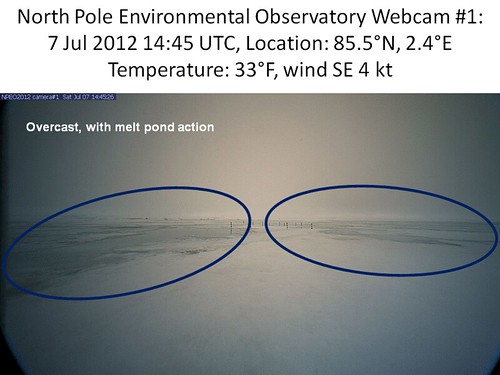
As far as a visual of the North Pole (or something close to it) goes, the NOAA webcams continue to be at work. The image below was capture at 14:45 Universal Time (Greenwich Mean Time for you old-fashioned folks) on 7 July 2012. Note the increased prevalence of melt ponds (highlighted with blue ovals). Temperature at this time was 33°F.
More below.


